
Contents
What a year 2021 was! Just as 2020 brought a myriad of opportunities and threats, 2021 presented all Microsoft Partners with its own array of challenges that forced them once again to adapt to a rapidly shifting landscape.
A banner year for the UK tech sector
While the world news has been bleak, by almost any measure it has been a stellar couple of years for the majority of the UK techsector.
The level of investment across the industry has been unprecedented in established businesses but especially in start-ups.
In fact, The British Business Bank reported that, UK business creation figures from March 2021 show that a new technology business was created every half an hour during 2020, with nearly 19,500 registering in total across the UK.
The extraordinary growth of the tech sector has been fuelled by steady global demand for digital transformation, the continuous growth in cloud migration and adoption of cloud solutions, and increased IT complexity driving demand for managed services.
Microsoft Partners we spoke to were ebullient about their success when we asked how their businesses had faired last year:
Good — we ended the year as the best ever.
Great — two consecutively best ever years. We were coming out of a bad patch. Lots of positive things have aligned.
By end of Q1 we will see over 30% growth.
We've been really fortunate in growing in last 12 months. We've grown 30%.
Strong growth, we doubled [sales in] 2020 and 21.
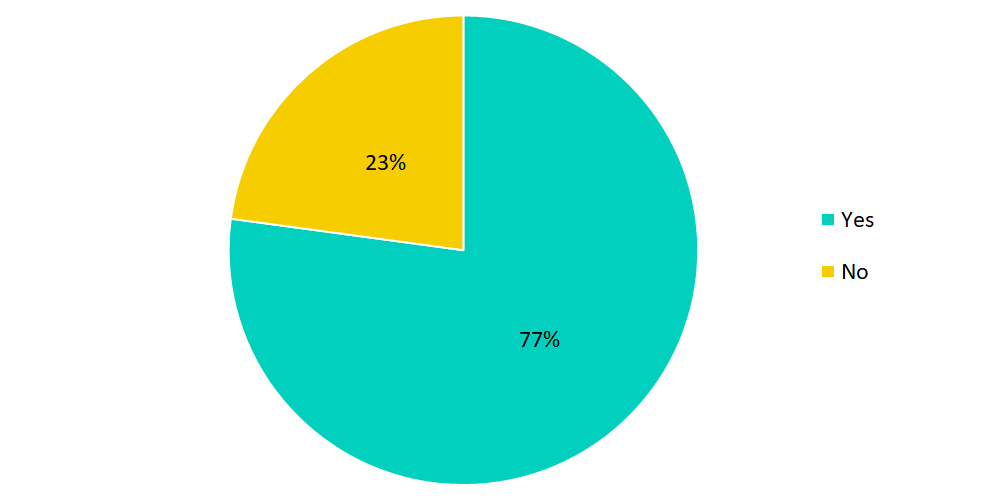
Revenue growth for ¾ of respondents
This theme was also reflected in the survey results where 77% of respondents said that revenue had grown over their last 12 months.
This was in line with last year's research, which showed an almost identical number (74%) of Microsoft Partners who saw revenue growth in 2020.
Did Revenue Increase?
The chart below shows the revenue split amongst the group.
Just under a third of companies surveyed generated revenue of between £2m and £4m last year.
This is roughly in line with 2020 figures across all revenue brackets, with a slight uptick this year in the £2-4m bucket (31% vs 25%), but a slight drop in £4-6m companies (17% vs 22%).
The average revenue generated across the group was £5.2m.
2021 Revenue per company
![Revenue_Per_Comany_2021[1]](https://www.law365.co/hs-fs/hubfs/Microsoft%20Partner%20Insights/2022%20charts/2.financials/Revenue_Per_Comany_2021%5B1%5D.png?width=1003&name=Revenue_Per_Comany_2021%5B1%5D.png)
Speculate to accumulate
How much did companies invest in sales and marketing to achieve these revenue numbers?
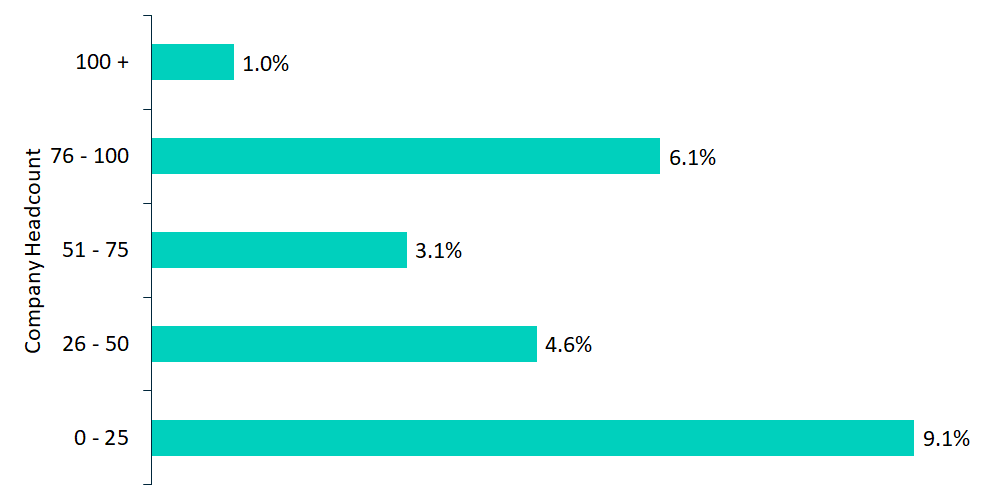
We found that the average sales and marketing budget (excluding salaries) across the group was 5.7% of revenue, including salaries this number jumped to 16.8%.
The smallest companies by headcount in the cohort had the highest average budget at 9.1%, with the largest companies (100+ employees) only assigning 1% of their revenue.
Sales & Marketing Budget as a % of Revenue (Exc. Salaries)
Whilst interesting to read, these numbers by themselves do not paint the full picture as many variables come in to play when determining the appropriate percentage of gross revenue to allocate to your sales and marketing budget.
It is widely acknowledged that newer companies will need to spend more in this space to establish themselves and their strategy, somewhere in the region of 12-20% (Hubspot).
More mature businesses who have already established a market share will often spend closer to 6-12%.
The Partners in our group were predominantly B2B and therefore their budgets should be slightly lower than a traditional B2C company's would be.
The forecast looks sunny for 2023
It was great to see almost all the CEO's in the group were bullish on the their companies sales pipeline for 2022 and beyond.
The majority forecast a significant jump in year-on-year (YoY) revenue growth, with the average being +21.2% in 2022 and +20.6% in 2023.
Revenue Forecast - Average
![Revenue_Forecast_2021[1]](https://www.law365.co/hs-fs/hubfs/Microsoft%20Partner%20Insights/2022%20charts/2.financials/Revenue_Forecast_2021%5B1%5D.png?width=1003&name=Revenue_Forecast_2021%5B1%5D.png)
Managed services and Professional services top drivers of revenue
This year we were able to dig deeper into the revenue numbers and gain a better understanding about which service lines are the main drivers for these Microsoft Partners.
Service Lines - Average Revenue Per Company
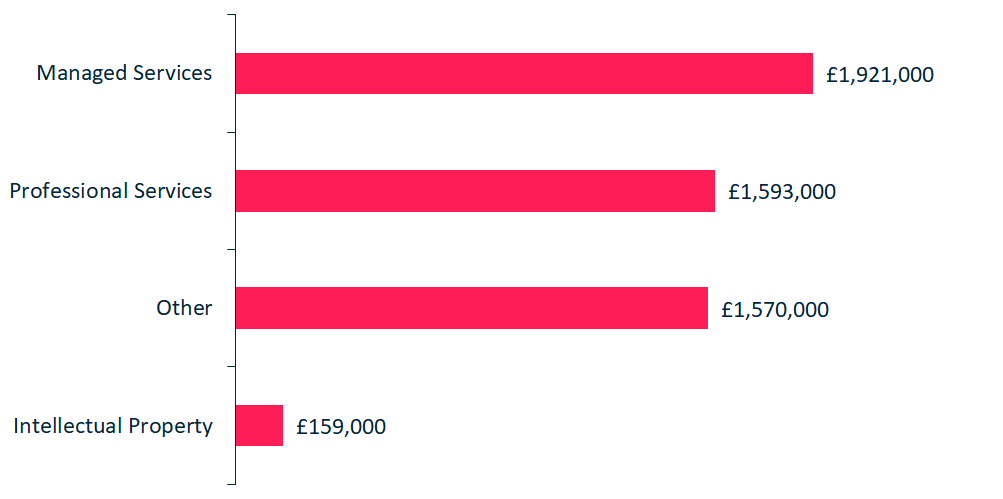
It will come as no surprise to most that managed services and professional services were the top two revenue generators on average and accounted for two thirds (67%) of all revenue generated by the surveyed group.
The impressive growth in recent years across in these two services is forecast to continue for some time with sources reporting
- 13% compound annual growth rates (CAGR) in digital transformation projects for the period 2022 to 2027 (Gartner)
- 6.3% for helpdesk/support (2022-2027 CAGR, Statista) and
- 15.8% for private cloud (2022-2030 CAGR, Allied Market Research)
Profit — The bottom line
The natural progression from revenue was to explore profitability.
Given the strong revenue numbers being reported by most of the Microsoft Partners we spoke to, we wanted to find out if profits had followed suit.
Over half of the partners (57%) said that EBITDA (Earnings Before Interest, Taxes, Depreciation, and Amortization) had grown in their last financial year.
Did EBITDA Increase?
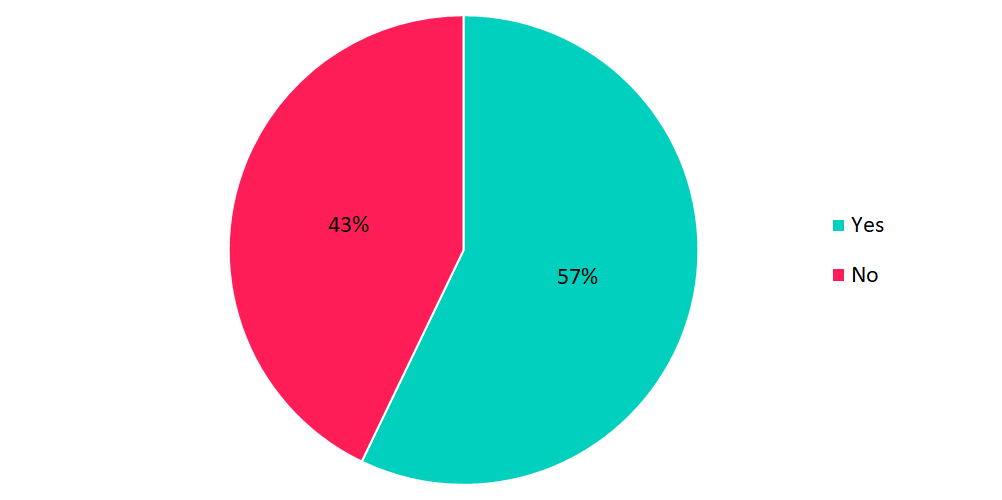
This was however, down on last year's results where 69% reported an increase in EBITDA.
Many CEO's in the group commented that wage inflation and the ‘war on talent' had impacted the bottom line as several were not able to fully pass this increase in cost on their end clients.
Additionally, many of the previous year's costs had been reduced because of the pandemic, however spending has risen on travel, subsistence, client, and staff entertaining.
It was encouraging to see that within these numbers 97% of respondents were profitable in the same period.
When grouping the partners by profit, the results at the smaller end of the spectrum were largely unchanged from last year, 49% of the group reported EBITDA of £0-0.5M compared with 47% the year before.
All companies surveyed were profitable compared to 6% last year who were not.
Overall, 51% of the group generated a profit of greater than £500,000 versus 48% last year, and the average EBITDA for the group was £712,000.
2021 EBITDA Per Company
![EBITDA_Per_Company_2021[1]](https://www.law365.co/hs-fs/hubfs/Microsoft%20Partner%20Insights/2022%20charts/2.financials/EBITDA_Per_Company_2021%5B1%5D.png?width=1003&name=EBITDA_Per_Company_2021%5B1%5D.png)
Smart businesses claim Microsoft rebates
As was the case last year, the most profitable Microsoft Partners were those that claimed rebates and incentives from Microsoft and other vendors, such as Claiming Partner of Record (CPoR), Partner Admin Link (PAL), and Cloud Solution Provider (CSP) licence fees.
Many also received other funding from Microsoft to help deliver projects such as End Customer Investment Funding (ECIF).
These Microsoft Partners had ensured their contractual terms with their customers clearly outlined that they were entitled to the Microsoft rebates, which is not always the case — Many Microsoft Partners miss out on tens, or hundreds of thousands of pounds in rebates.
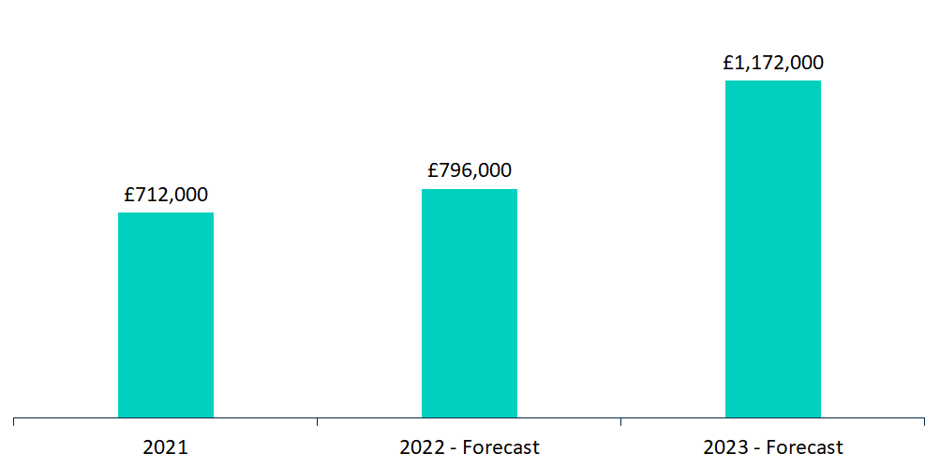
EBITDA within the group is forecast to grow in 2022, albeit it at a slower pace to revenue, to £796,000, an increase of+11.8%.
However, 2023 looks set to be much more profitable year with the average EBITDA forecast to be £1.17M, a jump of +47.2%.
EBITDA Forecast - Average
It was also interesting to see the results of EBITDA margin achieved in the group.
2021 EBITDA Profit Margin
![EBITDA_Profit_Margin_2021[1]](https://www.law365.co/hs-fs/hubfs/Microsoft%20Partner%20Insights/2022%20charts/2.financials/EBITDA_Profit_Margin_2021%5B1%5D.png?width=1003&name=EBITDA_Profit_Margin_2021%5B1%5D.png)
The Average EBITDA profit margin reported was 15.2%, and while it can often be difficult to give a target benchmark for Microsoft Partners on this (as this can depend on what type of Microsoft Partner you are; MSP, CSP, ISV, SI or IP business) an EBITDA margin of 10% is generally considered good for most industries.
When looking particularly at the tech/software sector, research conducted by Service Leadership last year found that the average MSP EBITDA margin was approximately 8%, while best-in-class service providers were operating around 19%.
This year's cohort therefore compare very favourably with this average, as 75% of the group generated above average (i.e. greater than 8%) margins, whilst 32% of the group were operating in the best-in-class range of 19%+ EBITDA margin.
While many Microsoft Partners have traditionally focused on recurring revenue and reducing operational cost in order to move out of the ‘average' bracket and towards the best-in-class range, more and more are shifting their attention to developing high margin products and services such as IP solutions that generate margins in excess of 50%, as an additional profitability driver.
I see the demand continuing, Microsoft have done a great job at creating a bow wave of predictive AI.
EBITDA Forecast - Average
![Gross_Margin_Forecast_-_2022[1]](https://www.law365.co/hs-fs/hubfs/Microsoft%20Partner%20Insights/2022%20charts/2.financials/Gross_Margin_Forecast_-_2022%5B1%5D.png?width=782&height=389&name=Gross_Margin_Forecast_-_2022%5B1%5D.png)
Looking past 2021, expectations within the group of sustaining these numbers did not quite match their revenue forecast assumptions.
As we can see above, the average EBITDA margin forecast for 2022 drops slightly by -1.8% to 13.4%, with wage inflation clearly having an impact on this.
With UK corporation tax set to increase to 25% from April 2023 it will be interesting to see how this affects forecasting in next year's research.
Wage inflation is really impacting us. We are probably looking at around a double increase than what it previously was. The market for tech is very hot, especially in front-end developers.
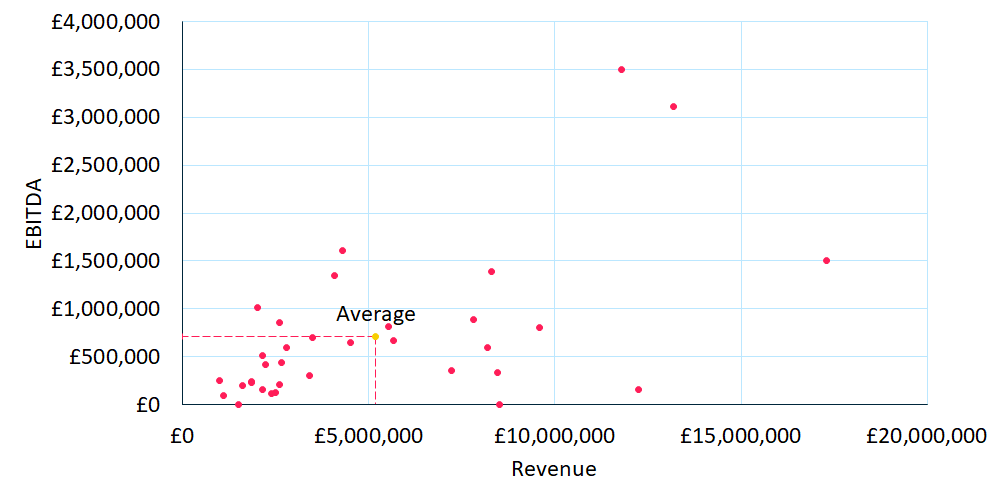
The chart (below) shows the dispersion of the participants revenue and EBITDA results around the group average of £5.19M revenue and £0.71M EBITDA.
2021 Revenue vs EBITDA
Revenue-per-employee is a key metric in understanding how leveraging your workforce can drive profitability. A TruMethods 2020 report explained (*converted to GBP):
An average MSP might make £800,000 in services with ten staff, which is £80,000 annual service revenue per employee. A world-class MSP can, however, generate £400,000 more revenue with the same number of staff, which means that they have significantly more leverage.
Their table below highlights how impactful this can be:
Top Performing MSP |
Average MSP |
|
|
Number of employees |
10 |
10 |
|
Annual service revenue |
£1,200,000 |
£800,000 |
|
Revenue per employee |
£120,000 per employee |
£80,000 per employee |
|
Additional profitability |
£400,000 |
|
The metric is a useful tool in assessing operational efficiency within a business and in formulating a plan to drive improvement. However, having full visibility on the revenue and cost drivers is the key here. Using their benchmark of £120,000 revenue per employee when looking at this year's results we see that the group's average of £102,000 is midway between the ‘top performing' and ‘average' (£80,000) MSP brackets. This is a sizable drop from last year's results where the average for the whole group was slightly in excess of £120,000.It is important to note however that almost one third (29%) of the participating Microsoft Partners we surveyed this year did achieve a revenue per employee greater than £120,000, with the best performer achieving £218,000.
2021 Revenue vs EBITDA Per Employee
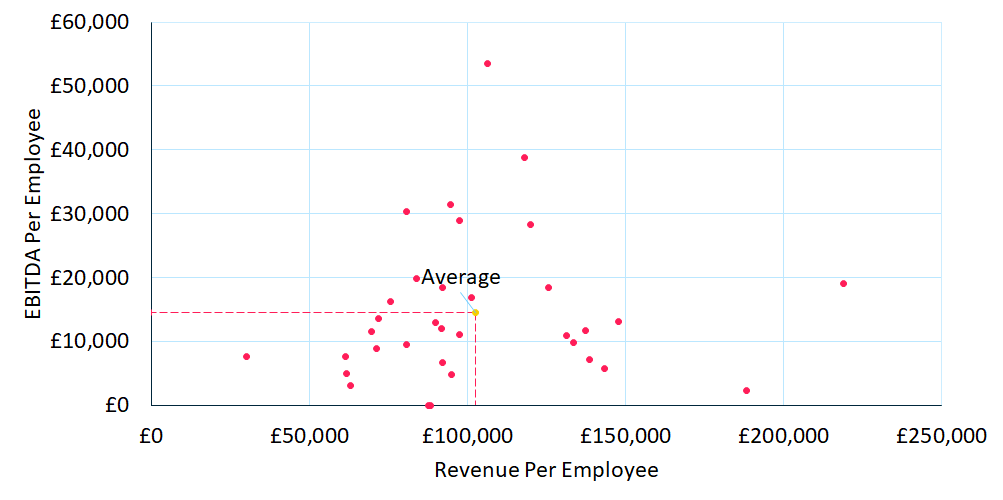
Finally, we can see that the average EBITDA per employee was £14,500, almost -17% versus last year's reported number of £17,500.
Most Microsoft Partners are people businesses, so their biggest cost is salaries. Therefore, any increase in the cost of labour, or wage inflation has a detrimental effect on profits and the amount of EBITDA per employee. However, the fall in revenue-per-employee could also suggest less operational efficiency (potentially due to staffing issues, working from home etc.), or increased price competition.
It has been good, we've grown by 12%. But we could have grown more but weren't in operational shape. We just couldn't hire fast enough.
The future - areas for concern
So the future looks bright for Microsoft Partners? For many yes, but for others, approaching the future with caution was their message. Several of the CEOs we interviewed said they had started to see clients slowing their spend and were feeling the early impact of inflation.
We're seeing a slow down on spend where people are looking to release smaller buckets of cash. Cost of sales is going up.
It's challenging. Business growth has not been as impressive as we would like. We're shrinking to grow again.
I'm quite anxious given that lots of our customers are retail.
We got a glut of customers who just kept spending throughout lockdown. But then many of our top customers slowed down spend. We had scaled up resource to meet what we thought we would need. So, it really hit us hard.
I do see inflation as a massive problem which will get worse.
For others the challenges brought by an increasingly competitive marketplace was a source of concern. Datto's Global State of the MSP Report highlighted that 34% of Microsoft Partner's polled said that increased competition was their biggest concern. This was the first time that competition had topped their list.
We had a lot of competition with London-based IT companies. Geordie shoring! They can pay them less but have the kudos of a London base.
Increasingly other Partners are building data and AI capability. That's not a major risk, just something we need to be mindful of.
Some of the Microsoft Partners were trying to stay ahead of the competition by supplementing their offering or changing their business model.
It's been good, but it's been hard. We are trying to reinvent ourselves by moving to become a product company. Lots of change, lots of learning.
IP is now our primary focus. Everything else is just about keeping the lights on while we develop this.
We are trying to migrate to become a BI company.
IP is strategically something we want to look at it more. It is currently intentionally opportunistic. In the future we anticipate having a Head of Innovation.
An area we will focus on in later blogs is recruitment, as the topics of resourcing, capacity, and the inability to hire people quickly enough was a constant talking point with those interviewed.
We're on the journey but nowhere near where we want to be. Capacity is the barrier, we need to hire more people.
Resourcing is always the challenge.
We aren't constrained by the market. We're asking to grow another £5-10m, we will be constrained by our ability to deliver.
This is understandable when put into context.
- 93% of employers are hiring in one form or another in 2022, compared with 82% in 2021 (Monster)
- IT/technical positions take the 6th longest time to fill behind engineering, research, project management, business development and finance (LinkedIn 2021).

Business Applications and Systems
This is the tenth instalment in this year’s Microsoft Partner Insights, our annual research into Microsoft Partners.

7. Microsoft Partner Insights - Sales & Marketing
We continue the Microsoft Partner Insights blog series with a look in to the sales and marketing operations of the key...

The IP Staircase
This is the eighth instalment in this year’s Microsoft Partner Insights, our annual research into Microsoft Partners.